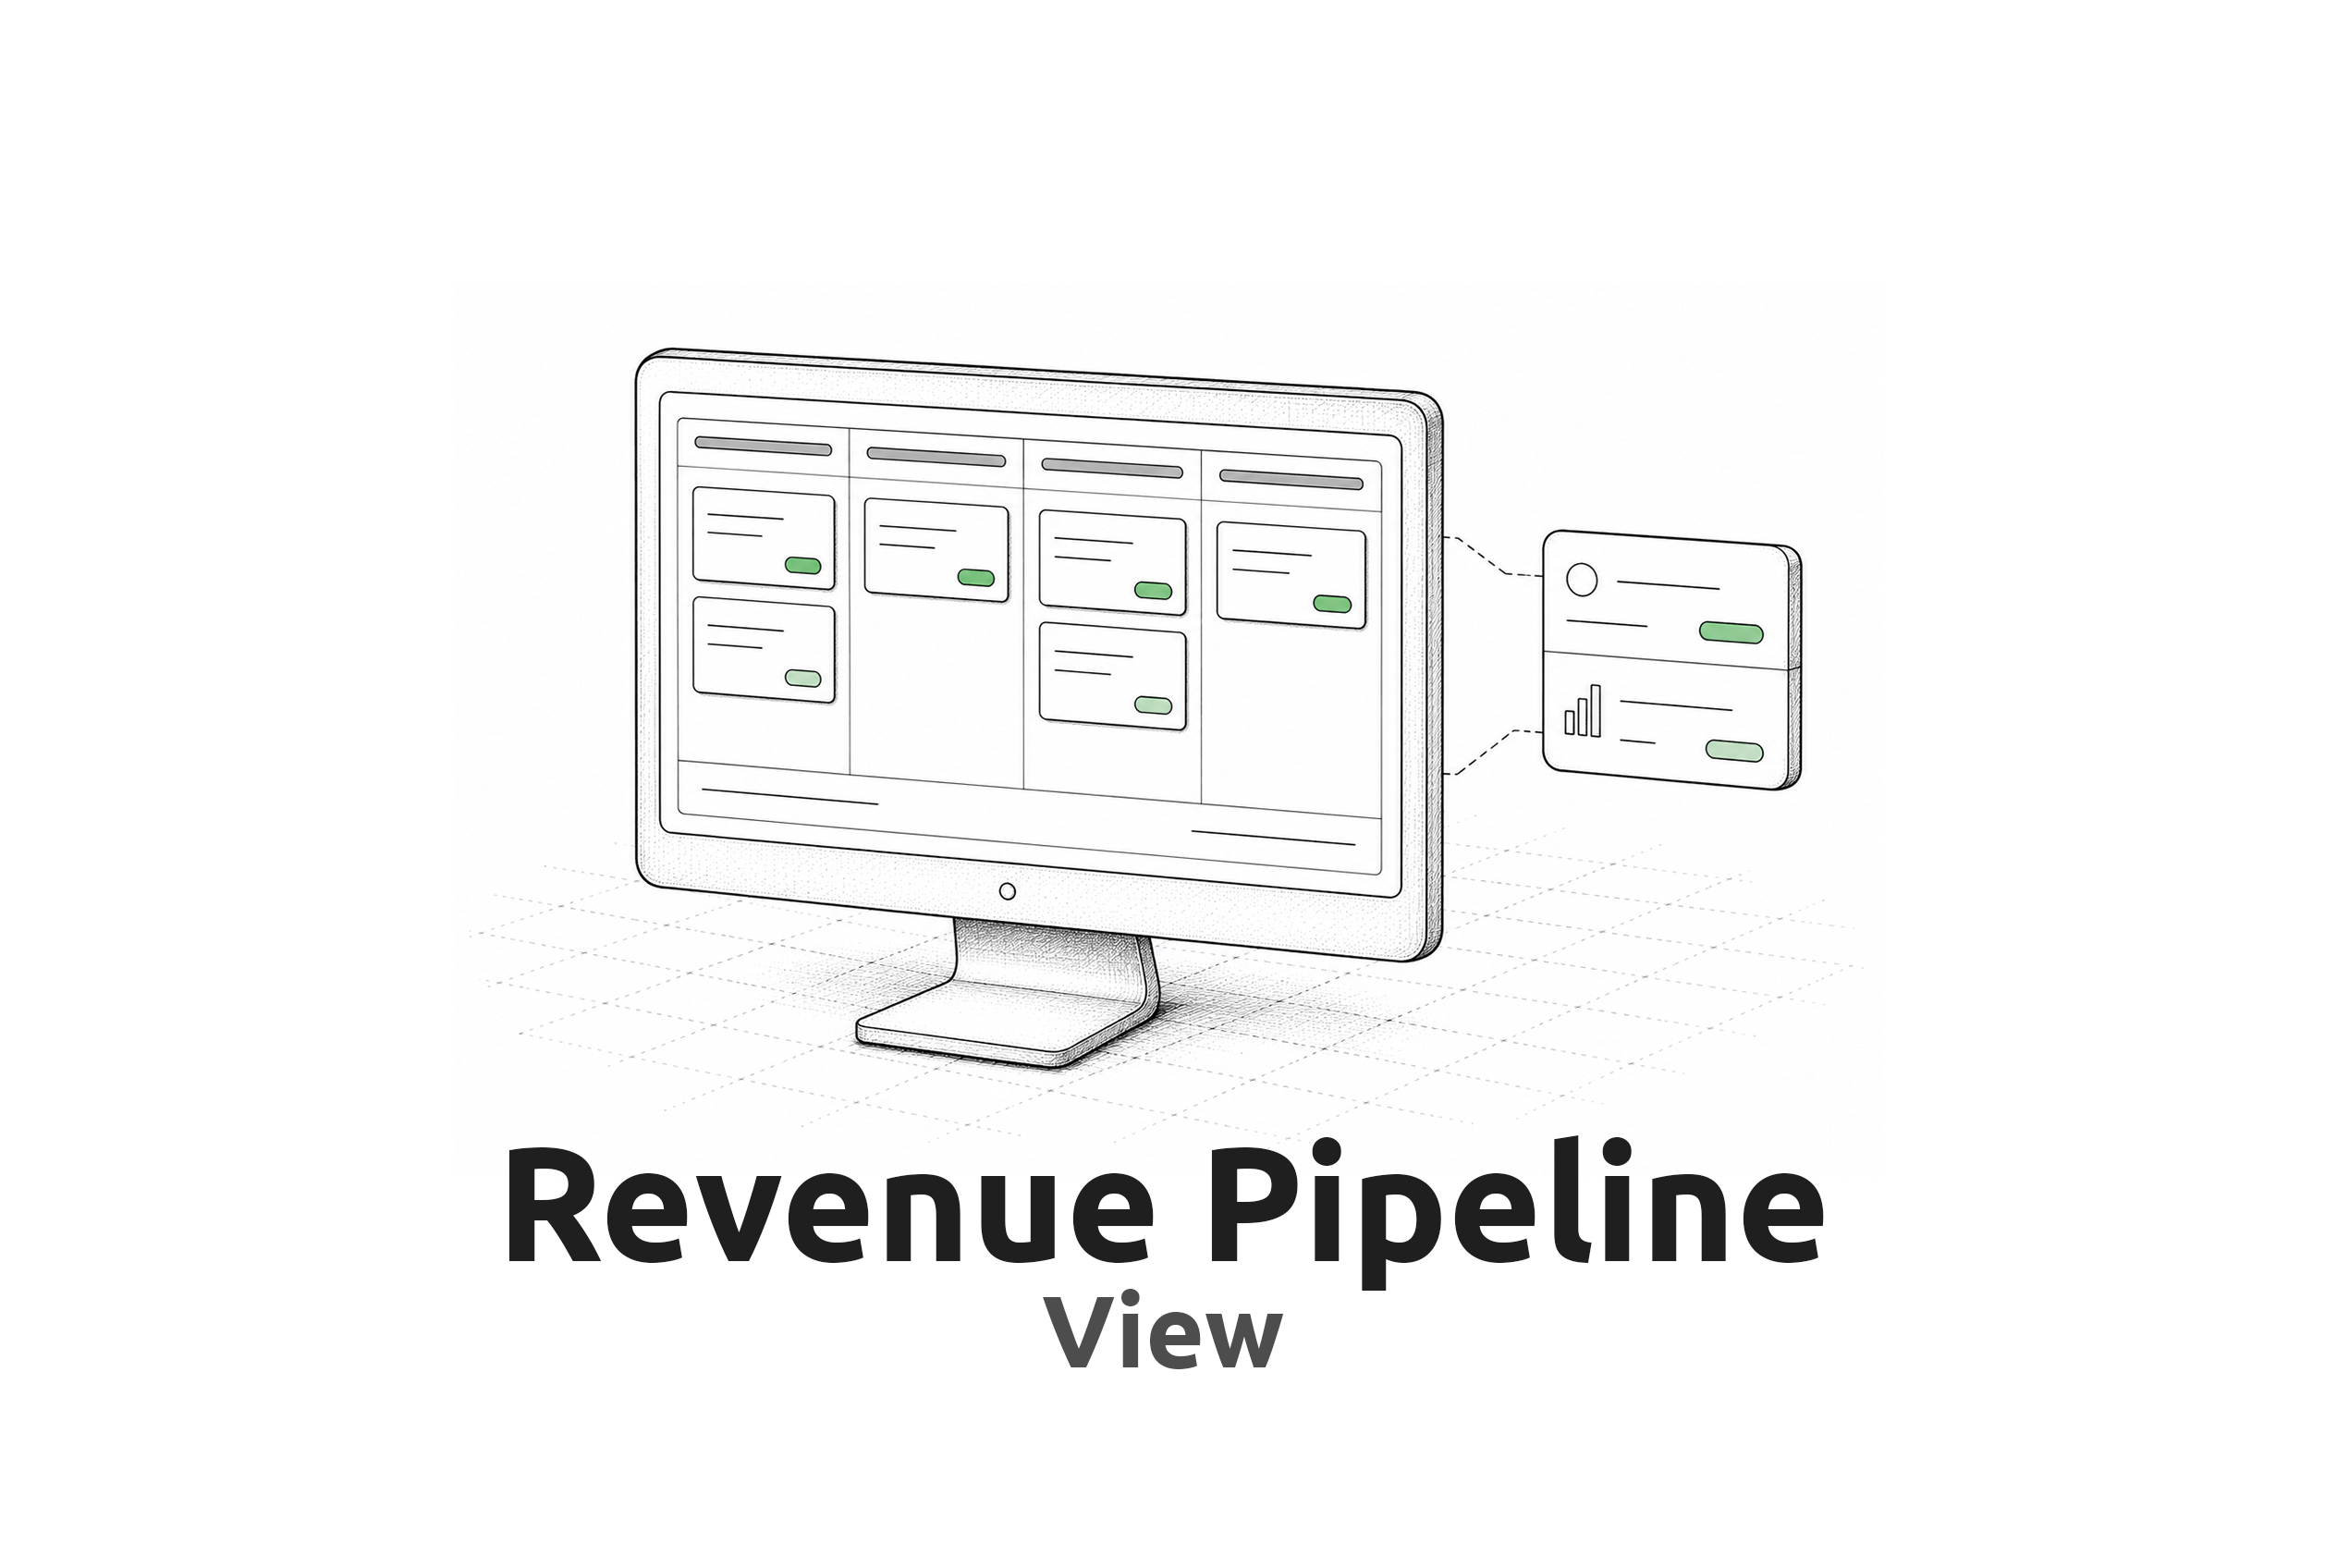
Revenue Pipeline View
Most pipeline views collapse complex commercial reality into a single number. The total value of tenders in flight. Useful as a snapshot. Misleading as a forecast.
Revenue Pipeline Forecast accounts for two things that pipeline value does not. The first is that win probability does not match tender stage. A late-stage tender with no buyer relationship and a strong incumbent is not seventy percent likely to land. Win probability is set per opportunity, by the team, based on the actual qualification context. The second is that contract revenue arrives across a delivery period. A five-year contract worth half a million dollars does not land on the day of award. It lands as roughly eight thousand dollars a month for sixty months.
Combine the two, and the pipeline turns from a single value into a month-by-month revenue forecast across coming months and years.
The use case for this came from real experience. Tender teams get busy delivering, forget to keep submitting, and three months later there is a revenue gap nobody saw coming. The forecast view illustrates which months are light. November and January are usually light. Knowing that lets the team prioritise a few smaller tenders to fill the gap before the gap becomes a problem.
The calculation is deliberately rough. Contract value divided across the delivery period. Most government payment schedules work that way anyway. The point is not financial modelling precision. The point is enough visibility to drive better commercial decisions about which tenders to chase next.